new
Reporting
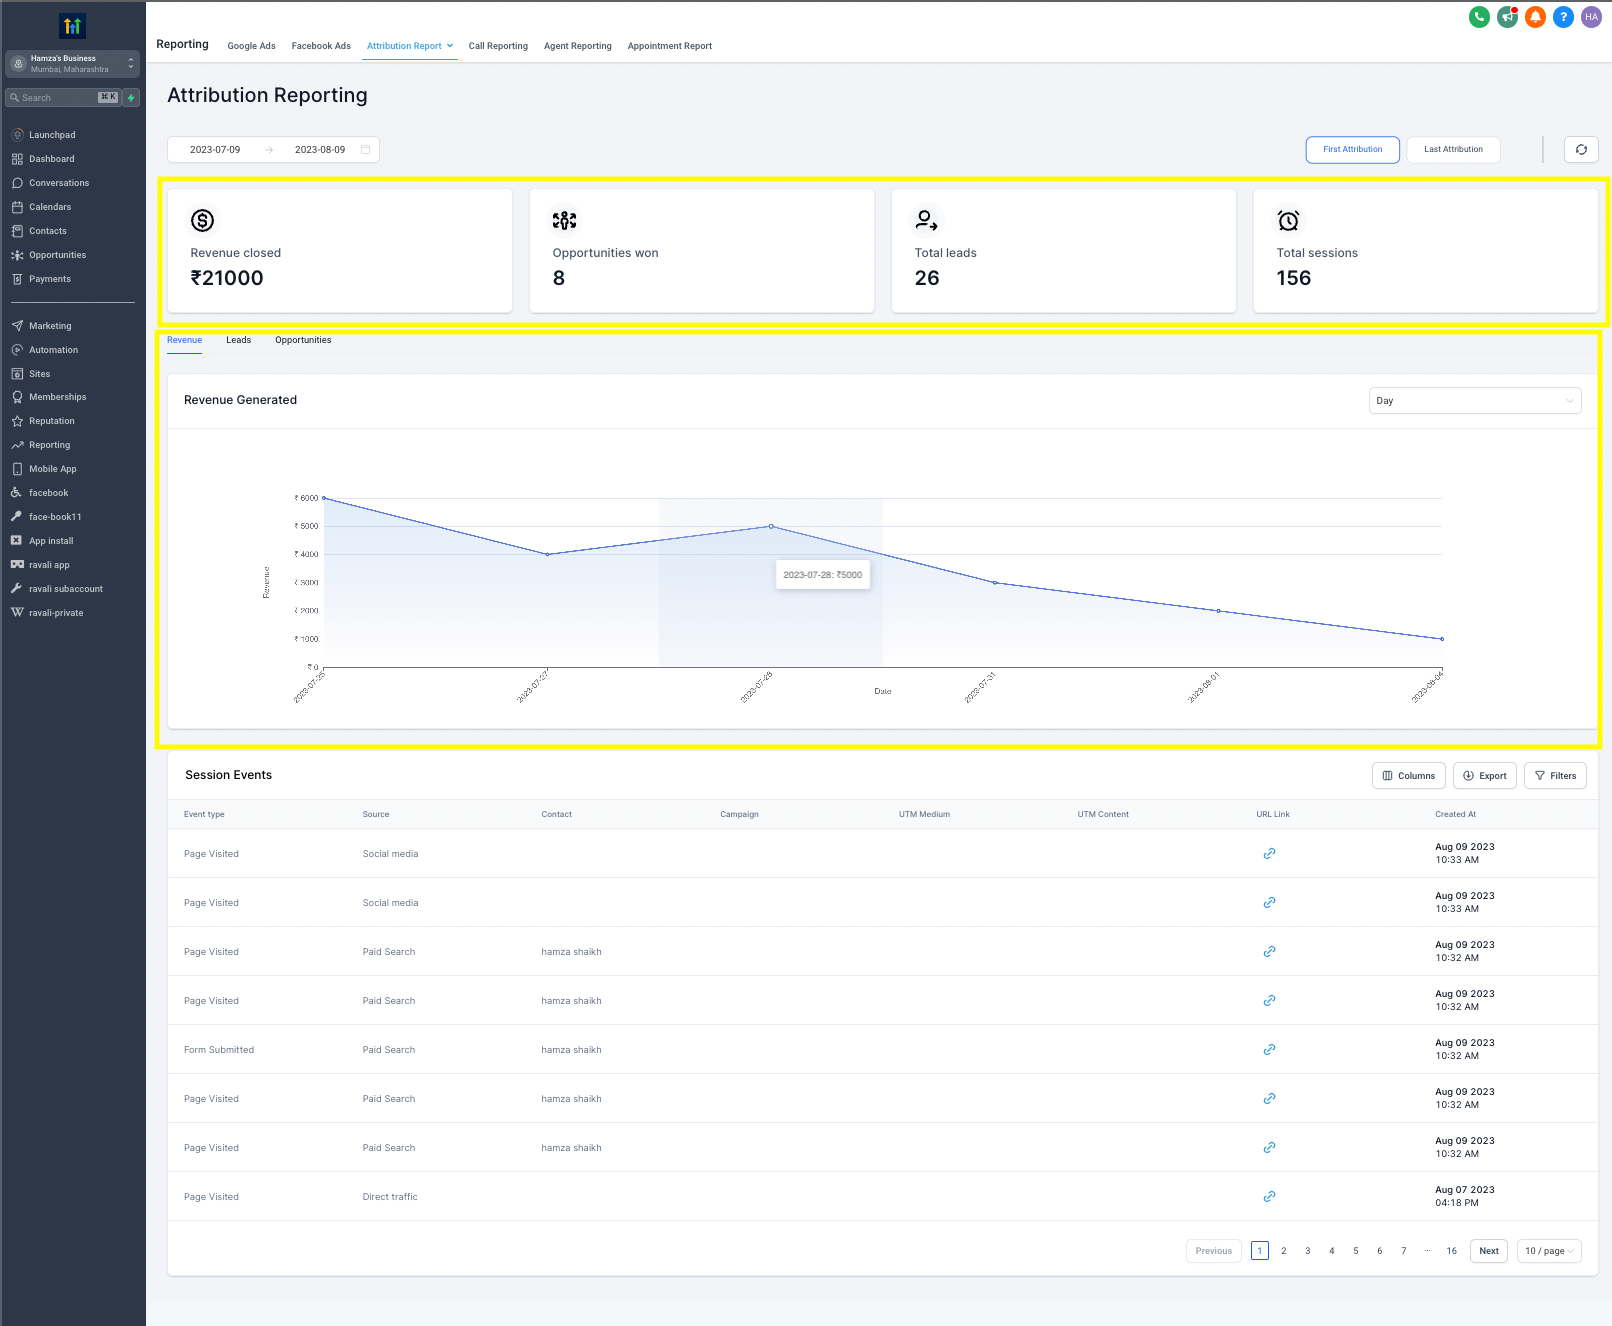
Enhanced Sub-account Attribution Reporting 📊
We're thrilled to roll out phase 2 of our optimized Attribution Reporting. It's designed to give business owners richer insights into revenue, leads, opportunities, and sessions. Dive into our revamped Attribution Reporting with advanced data points and a fresh design!
📈
New Features & Improvements:
▸
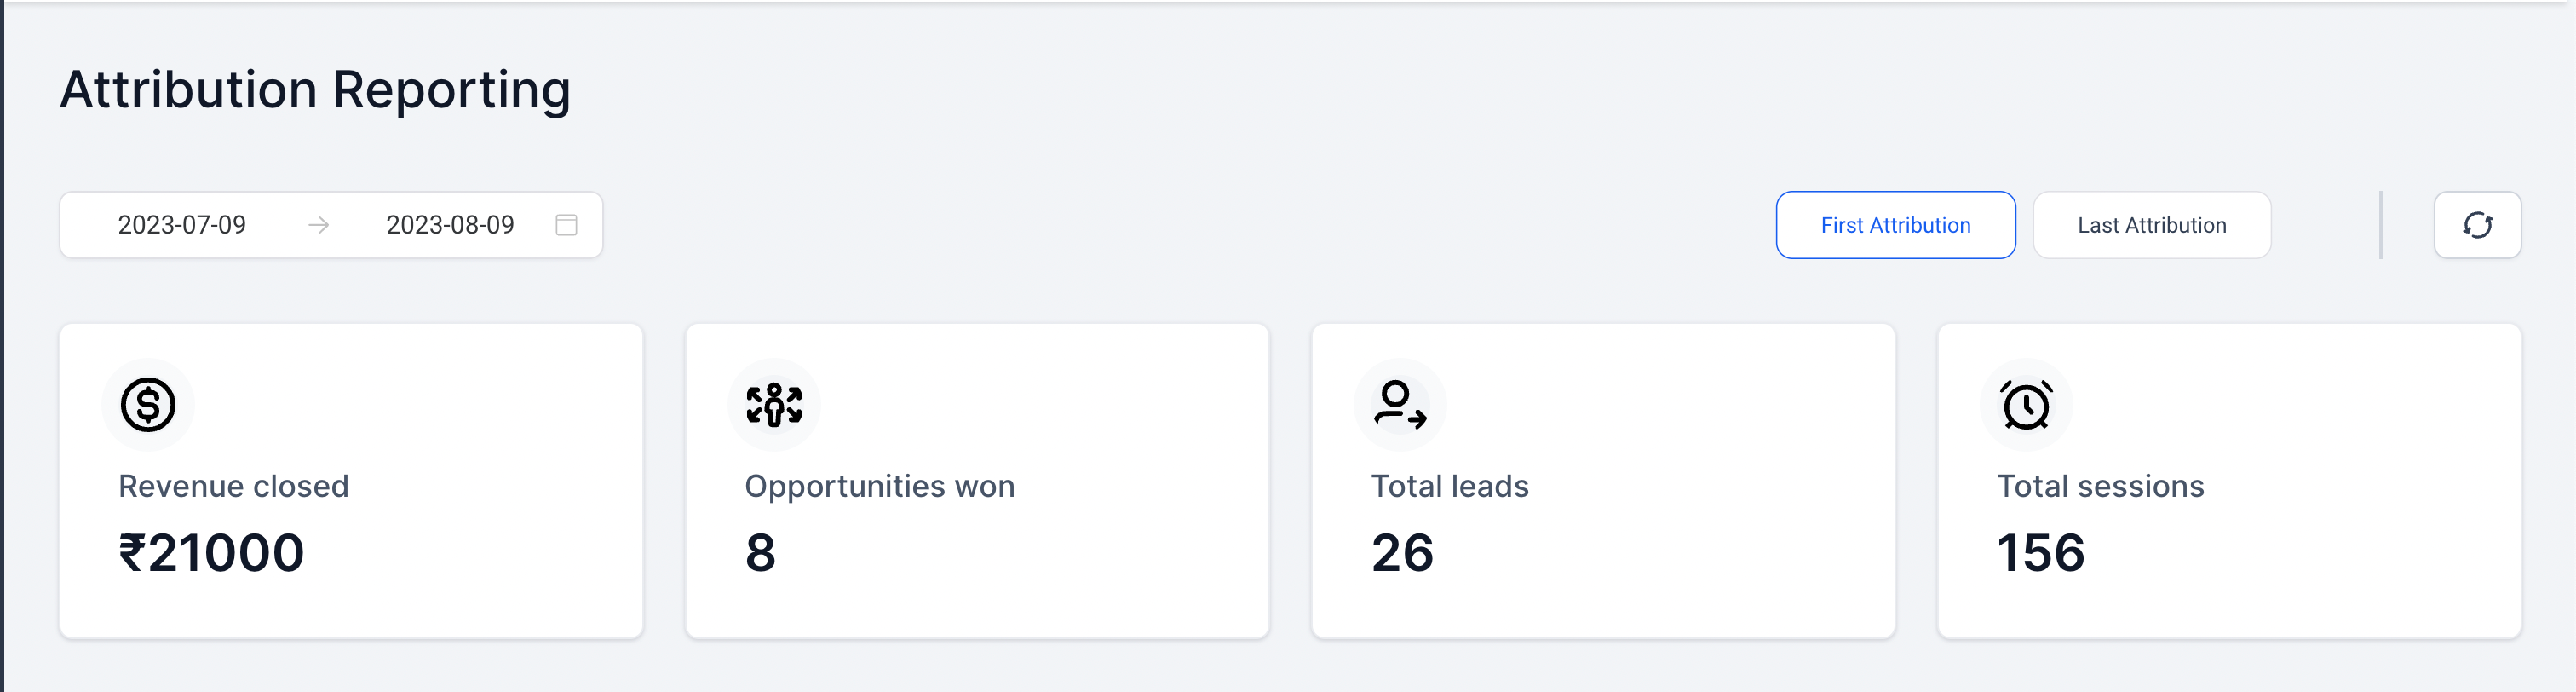
Top Stats Overview:
At a glance, see pivotal metrics such as Revenue Closed, Opportunities Won, Total Leads, and Total Sessions.▸
Revamped Statistics Tab:
Back by popular demand, we've reintroduced the statistics tab for a quicker and clearer understanding of the data. This tab will showcase:- Revenue Closed
- Opportunities Won
- Total Leads
- Total Sessions
▸
Custom Dashboards:
These stats cards are prepping the ground for the Location Dashboard, where soon be able to craft a personalized dashboard.▸
Revenue Generated Chart:
A brand-new revenue-generated chart pinpoints the dates fueling the most revenue to the business.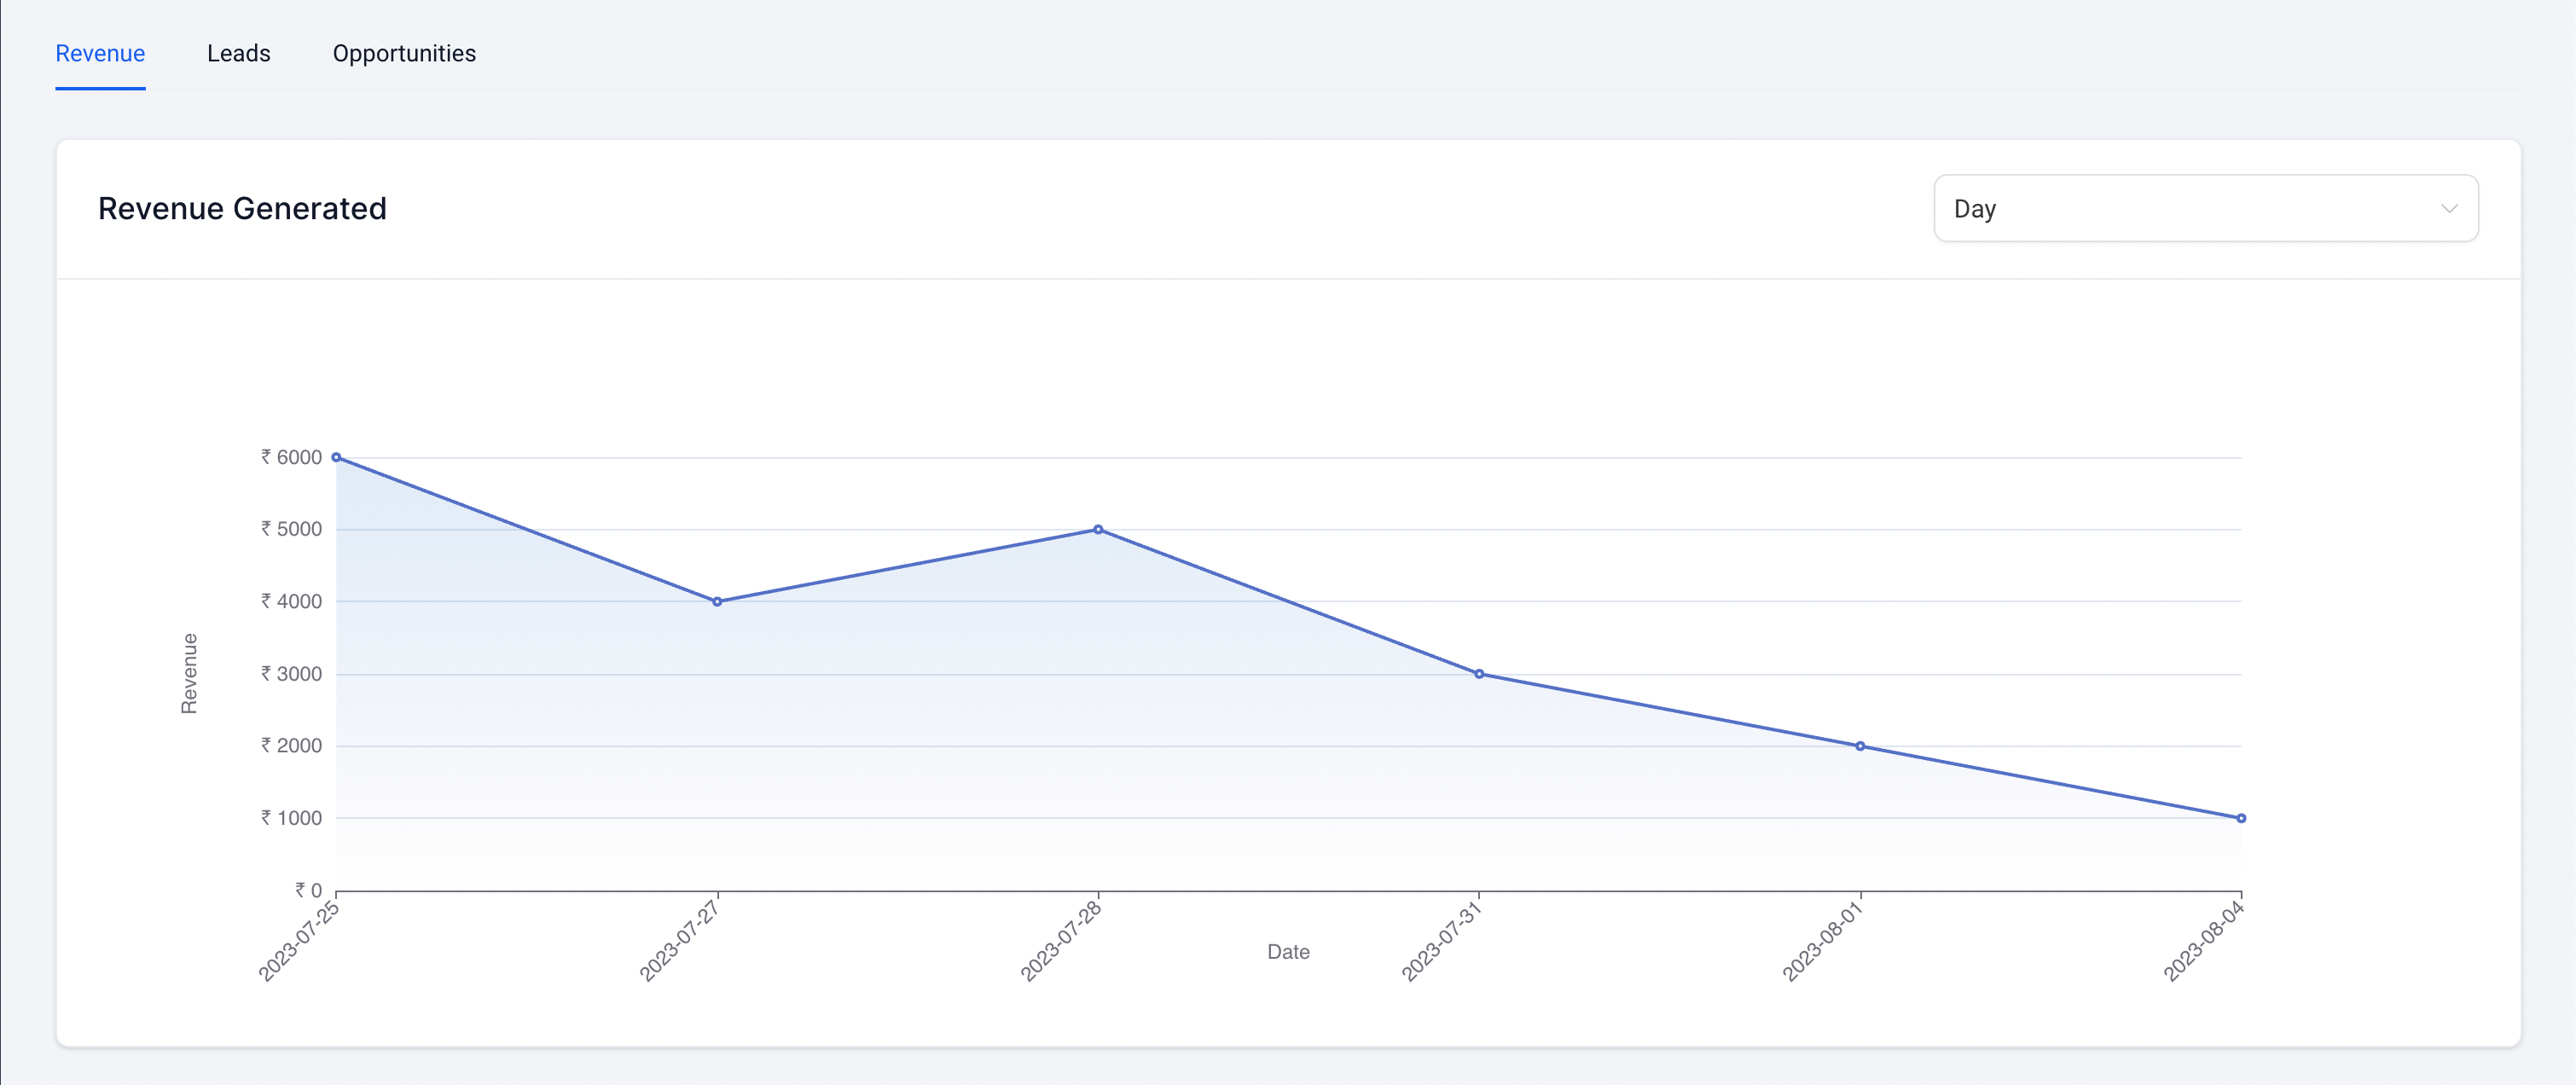
▸
Internationalization Support:
The updated section is now multilingual with our internationalization feature.Dive in, explore, and harness the power of these advanced data points to boost your customer's business! 📈